| Repo | Release | Link | Client | Features | Developer |
|---|---|---|---|---|---|
| repo | 16/12-24 | link | Braekhus | data-visualisationstatisticst2 | Eystein |
Functionality
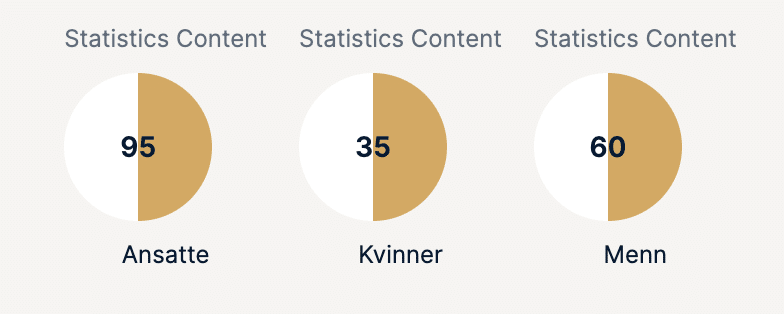
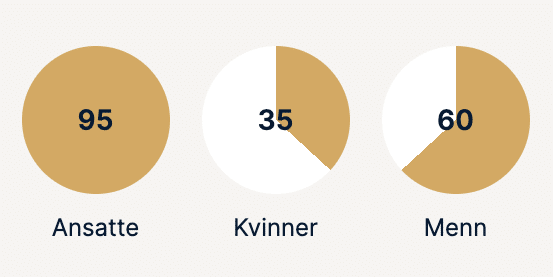
Redesign of the T2 Statistics block, to display as pie charts. The first pie contains the total (100%), and the size of the following pies pies are based on that.
Editor
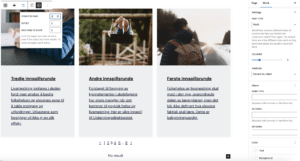
The diagrams are not sized properly in the editor, but a static 50% regardless of input.
